|
|
Vector DiagramVector DiagramIn a vector diagram, a vector quantity is represented by an arrow.
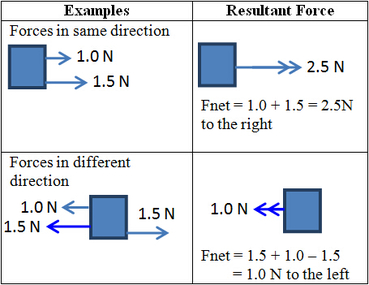
The length of the arrow is proportional to the magnitude of the vector quantity; The direction of the arrow is the direction of the vector quantity. In a vector diagram, we use a single vector called resultant vector (or net vector) to represent the individual vectors combined in terms of magnitude and direction. A resultant vector is indicated by a double-headed arrow while individual vector is a single-headed arrow. Note that the following illustration is associated with forces but vector diagram is applicable to all vector quantities like displacement or velocity and so on. Addition of Parallel forces
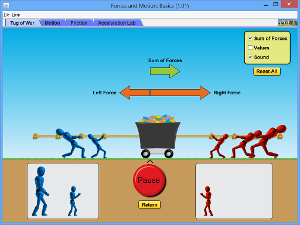
To help you understand this better, you can play with the below applet.
Addition of non-parallel forcesTwo methods
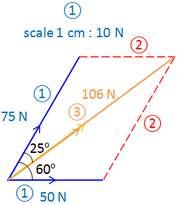
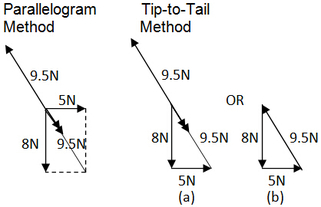
(1) Parallelogram Method (2) Tip-to-Tail Method A detailed illustration on these two methods is shown in the example below. Example 1
Consider two forces that are not acting along the same line (i.e they are not parallel) on an object, find the resultant force. 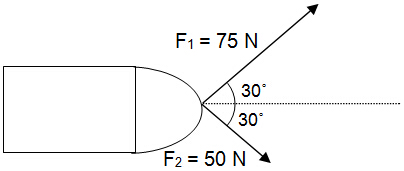
Parallelogram Method
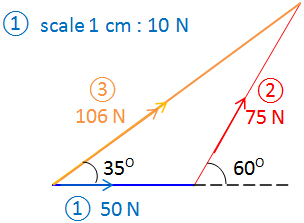
Tip-to-Tail Method
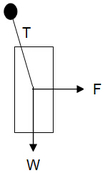
Note that when there are only two forces and you are asked to find the resultant force, you could proceed with any method by following the steps mentioned above. However, when a system is in equilibrium (normally there would be three or more forces), it is much easier to use Tip-to-Tail Method. Refer to Example 2 Tip-to-Tail method (b).
Two observations here:
(1) T is in the same magnitude but in opposite direction as the resultant of W and F.=> system is in equilibrium. (2) For Tip-to-Tail method (b), all arrows are single-headed and flow in one direction. Note that in Tip-to-Tail method, the resultant force is drawn from the starting point of first force to the end point of last force whereas the equilibrium force is drawn from the end point of last force to the starting point of first force. Example 3: 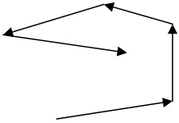
(a) What is the resultant force for the above system?
(b) How to make the system stationary? Answer: 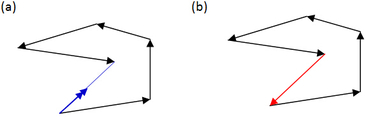
|
|