|
|
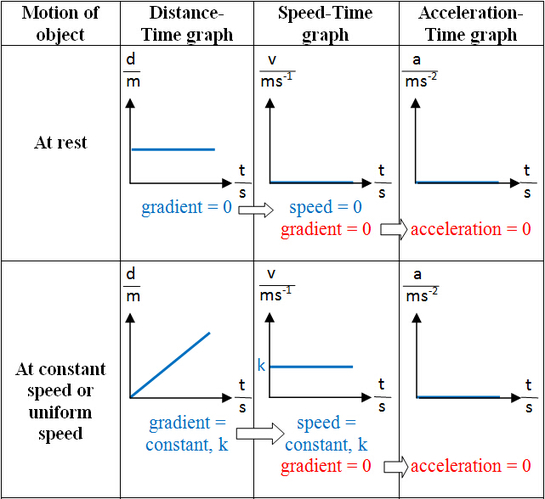
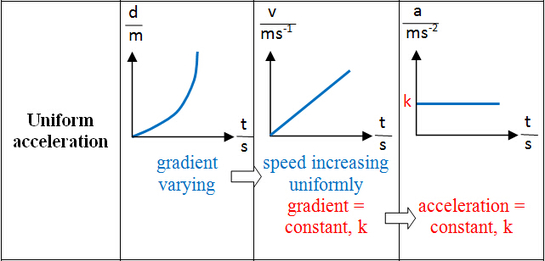
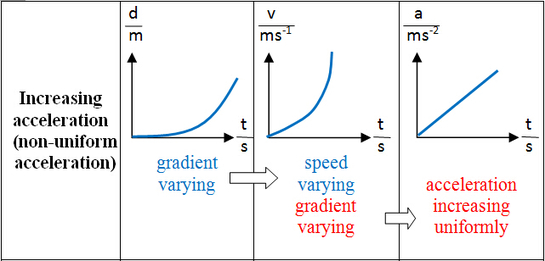
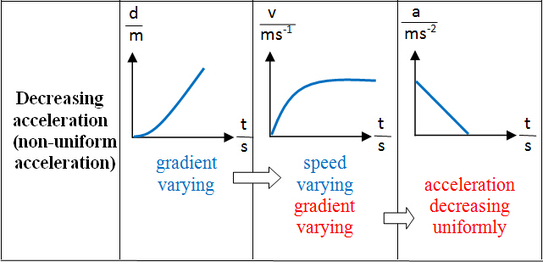
Kinematics GraphThree types
RelationshipsDetailed IllustrationExample:
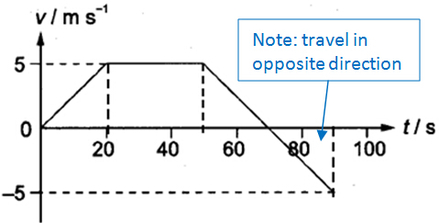
A girl starts from rest and travels along a straight line. The diagram below shows the velocity-time graph of the girl from 0 s to 90 s. (a) Describe the motion of the girl from 0 s to 40 s.
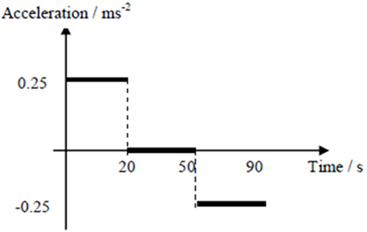
(b) Find the average velocity of the girl in the first 70 s. (c) Draw the acceleration-time graph of the girl from 0 s to 90 s. (d) Find the displacement of the girl from the starting point to the position at 90 s. Answer:
(a) From 0 s to 20 s, she travels with constant acceleration of 0.25 ms^(-2); From 20 s to 40 s, she travels at constant velocity of 5 m/s. (b) Total displacement = area under v-t graph = ½ (30 + 70) * 5 = 250 m Average velocity = 250/70 = 3.57 m/s (c) Acceleration is the gradient of v-t graph. (d) Displacement = area under v-t graph
= 250 – ½ * 20 * 5 = 200 m Tips: (1) It is very easy to mix up kinematics graphs. The only way to differentiate these graphs is to look at the y-axis! (2) When describing the motion, do it region by region! And always talk about acceleration or speed / velocity with values if applicable. Refer to example above. |
|


